
Best suited for ages 11 to 15
Table of Contents
- Build your own Barometer
- You and the Brewer
- Using Your Centre of Gravity
- Take a Deep Breath
- How Dirty is the Air?
- The Formation of our Solar System
- UV Radiation and Clouds
- Make a Rain Gauge
- A Tasty Experiment!
- Tsunami Demonstration
- "Make Before Break"
Build your own Barometer
Environment and Climate Change Canada
This project explains how to make a barometer to show changes in air pressure.
Materials
- Empty glass container or soup can
- Elastic band
- Glue
- Adhesive tape
- Balloon
- Drinking straw
- Index card about 8 cm by 13 cm (3 inches by 5 inches)
Method
Cut a piece out of the balloon large enough to cover the top of the glass jar or soup can.
Stretch that piece of the balloon tightly over the top of the jar or can and secure it in place with the elastic band.
Cut the straw so that it is about 10 centimetres long and trim one end to a point.
With the sharpened end pointing out, lay the straw on the balloon with the flat end at about the centre of the balloon.
Glue the straw in place.
Draw reference marks on one of the long edges of the card at roughly half-centimetre intervals. Tape the opposite (unmarked) side of the card to the jar, with the narrow end of the rectangular card extending above the jar top and the marked edge just behind the straw. The marked edge should stick out so that the sharpened end of the straw points to the reference marks.
Points of discussion
The piece of the balloon that is stretched across the jar will act as a membrane. When the air pressure outside the jar rises, it will push down on the balloon, forcing it slightly into the jar. This, in turn, will cause the end of the straw to rise. Similarly, when the air pressure outside falls, the air pressure in the jar will be greater than the air pressure around it forcing the balloon to bulge slightly. This will cause the end of the straw to drop.
You can chart the position of the straw against the reference marks on the card each day. This will not give you a numeric reading but it will tell you whether the air pressure is rising or falling. The pressure trend is an important tool in forecasting.
Please remember to keep your barometer away from sources of heat such as radiators and sunny window ledges. If it is close to a source of heat, then your barometer will act more as a thermometer, with the air inside expanding and contracting to reflect changes in temperature, not pressure.
You and the Brewer
Health Canada
Environment and Climate Change Canada uses Brewer spectrophotometers to forecast the UVI levels for each day of the year. These are posted at:
http://weather.gc.ca/forecast/public_bulletins_e.html?Bulletin=fpcn48.cwao
Purpose
To compare UV values from different locations.
Method/Observations
Use the chart below to record two weeks of UV Index listings from the Web site (obtain the maximum UVI value for the closest Brewer station to you), and your local media. If you have access to a UV meter, you can use it to obtain your own reading as well (use the meter at solar noon to obtain your maximum UVI value).
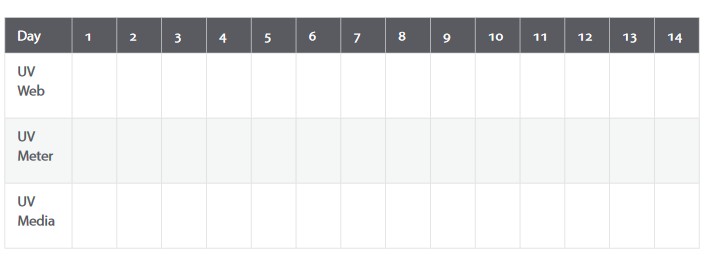
Discussion
- Using your data, plot a graph of the daily UV radiation levels.
- Continue to record and post a two-week period so that the class can produce cumulative graphs of UV readings over several months.
Conclusion
What have you learned from your comparison?
- Which month(s) of the school year have the highest UV readings?
- How does this relate to the reported seasonal ozone layer thickness?
Using Your Centre of Gravity
National Research Council Canada
Gravity is one of the forces that control how the physical world works. It keeps trying to pull things towards the centre of the Earth. Without realizing it, we've learn to outsmart gravity. Otherwise, we would fall over every time we took a step. We "outsmart" gravity by positioning our centre of gravity - an imaginary spot in the middle of the stomach about 8 cm below the belly button. It's the point around which all our weight seems to be centred. As long as we keep the centre of gravity over our feet, we can stand and walk.
Purpose
To experience how gravity works on Earth
Materials and Equipment
- Wall
- Chair
- Partner
Method
Activity #1
Work with a partner. Tell your partner that you are going to glue his or her foot to the floor with a special glue. Have your partner stand so that one foot and the side of their head are against the wall. Tell your partner that the foot farthest from the wall is "glued" to the floor.
Ask your partner to raise the "glued" foot out to the side. Record the results.
Where is your centre of gravity when you are leaning against the wall? How does this affect your ability to move sideways?
Activity #2
Next, ask your partner to sit in a chair with his or her head tilted backwards. Put one finger on his forehead and press lightly. Challenge him to get up. Record the results.
What happens to your partner's centre of gravity when he is sitting in the chair? How would he have to change it in order to move?
Activity #3
Have your partner rest his head against the wall while his feet are at least 45 cm away from the wall. Pretend to "glue" his head to the wall. Challenge your partner to move his head away from the wall while keeping his feet flat on the floor. No hands are allowed. Record the results.
Switch roles and try the activities again.
Where is your partner's centre of gravity in this experiment? In what direction does gravity want to pull your partner? What is keeping your partner from falling over?
How will changes in gravity affect astronauts aboard the Space Station?
Observations/Results
Record your conclusions. Conduct the activities several times and record the changes in the results.
Take a Deep Breath
Canadian Space Agency
In this activity, students learn that air quality on board the International Space Station (ISS) is a major concern. In the open environment of the classroom, the CO2 from the students' respiration poses no threat to air quality because it is removed by the ventilation system. In a closed environment such as the ISS, however, CO2 can be harmful because it reduces the amount of available oxygen. The suggested experiment is qualitative in nature. The reaction of lime water to CO2 becomes more pronounced as the gas's concentration in the air increases.
Hypothesis
Formulate a hypothesis about the relative levels of carbon dioxide in the atmosphere and in the air you exhale.
Materials
- 3 100 ml beakers
- 1 syringe
- 1 straw
- 150 ml of lime water
Experiment Procedure and Observations
- Label the three beakers.
- Pour 50 ml of lime water into each beaker.
- Use the syringe to make air bubbles in the water of the first beaker and record your observations.
- Use the straw to gently blow bubbles into the water of the second beaker and record your observations.
- Let the third beaker sit in the open air until the next day and record your observations.
Analysis
Compare the appearance of the lime water in each beaker.
Conclusion
What do you conclude about the relative amounts of carbon dioxide in the atmosphere and in the air we exhale? Why did the water in the first beaker become cloudy more quickly than the water in the third beaker?
How Dirty is the Air?
Health Canada
Try this experiment to find out about... Particulate Matter. What's that word? It's a fancy word for all the little things like dust, dirt, soot, smoke that are too small to see.
What you'll need:
- coloured markers
- labels
- white cardboard
- #five jar lids
- magnifying glasses
1. Write the numbers 1 through 5 on the labels, then attach a label to the top of each jar lid.
2. Place the jar lids on a piece of cardboard. Carefully trace around the jar lids, then number these circles to match the numbers on the lids.
3. Take the cardboard and lids outside. Place them #at in an open area. (Rain or high winds will spoil the experiment, so keep an eye on the weather reports!)
4. At the end of the fi#rst day, remove one lid, starting with number one. For the next fi#ve days take away one lid each day. Are the circles different?
5. At the end of the #fifth day, take away the last lid and look at the circles. If the air is dirty, the circles covered by the low-numbered lids will have more specks of dirt than the others. Use a magnifying glass to count the dirt specks.
Is our air clean or dirty?
The Formation of our Solar System
Canadian Space Agency
This hands-on activity examines the Solar Nebular Theory as the solar wind begins to blow. Using materials to represent elements in the interstellar dust cloud, students will develop a model of how the solar system formed and will begin to compare characteristics of the planets.
Hypothesis Phase
- Introduce the activity by presenting the Solar Nebula Theory to students.
- Divide class into groups of 4-5 students.
- Give the groups time to discuss the information presented and develop a hypothesis statement about interaction of the solar wind and the interstellar dust cloud. Students should propose an explanation to support their prediction.
The Solar Nebula Theory is the most widely accepted hypothesis of the formation of our solar system. According to the theory, the Sun and planets were formed from a giant rotating cloud of interstellar dust and gas. Scientists believe that billions of years ago the centre of the spinning cloud collapsed in on itself, forming the Sun, with the remaining orbiting matter taking the shape of a spinning disk.
When the Sun burst on the scene at the centre of our solar system so did the solar wind. It was so strong that some of the matter was pushed out beyond the snow line of our solar system. The snow line, roughly in the middle of the asteroid belt, is the point where temperatures are cold enough for gases to become liquid and icy water. It can be compared to the snow line on a mountain on Earth where liquids are permanently in the form of snow and ice due to the extreme cold.
Questions to consider:
What type of matter blew away? What elements stayed closer to the Sun? What was the overall effect on the characteristics of the planets?
Experiment Phase
- Students will conduct a simple experiment to test their hypothesis.
- If space is limited, create a solar wind simulation area in the class room and have groups take turns running their simulation.
- It is recommended to test the position of the fan and elements as well as the duration of the "solar wind" prior to conducting the activity in-class.
Materials
- Solar Wind Simulator
- Fan (8-10 inch diameter)
- Interstellar Cloud
- Materials to represent the heavier elements in the cloud (4) - pebbles, marbles, beads
- Materials to represent the lighter elements in the cloud (4) - fluffy cotton balls, pompoms
- Roll of paper (white or brown Kraft paper at least 60cm wide)
- Colour markers (at least 4)
Procedure
- Roll out a swatch of paper (approximately 3 meters) along the floor and place heavy objects on the corners to hold it in place.
- Position the solar wind simulator at one end of the paper and draw a circle around it. This represents the Sun.
- Mix the elements of the interstellar cloud and position the materials in front of the fan.
- Turn on the solar wind simulator for 10 seconds.
- Use different colour markers to circle the resting place of the elements and create a legend to identify heavy versus light elements in your diagram.
- Record observations.
Analysis Phase
To complete the analysis phase, students should:
- Describe the distribution of the interstellar cloud elements as a result of the solar wind simulation
- Determine if their 'solar system' is in line with the actual solar system
Conclusion Phase
Based on the analysis of the experiment, students should conclude that the heavier elements remained closer to the Sun while the lighter elements were blown away.
The presence of the solar wind during the formation of the solar system is one of the most plausible theories to explain why the gas giants, made from lighter gases such as hydrogen and helium, are further away from the sun and the smaller terrestrial planets, made of heavier elements, are positioned closer to the Sun.
Here is how scientists explain this phenomenon:
When the solar wind began to blow, the lighter elements orbiting the newly formed star were pushed into the far reaches of the solar system while the remaining heavier elements stayed closer to the Sun and went on to form the rocky planets of the inner solar system - Mercury, Venus, Earth, and Mars. When the lighter dust and gas molecules reached the outer solar system, beyond the snow line, the solar winds became too weak to keep pushing the light elements away from the Sun. At this point the dust and gases condensed into liquid and ice crystals to form the planets known as the gas giants - Jupiter, Saturn, Uranus, and Neptune.
UV Radiation and Clouds
Health Canada
Cloud cover can greatly affect the amount of UV radiation received at the earth's surface.
Scattered clouds reflect UV, increasing the amount of UV radiation reaching the Earth's surface.
Mainly cloudy conditions partly reduce UV transmission.
Heavy overcast conditions greatly reduce UV transmission.
| Type | Factor | % UV |
| Scattered Clouds | 1.1 | +10% (transmitted) |
| Hazy | 0.9 | |
| Mainly cloudy with/without precipitation | 0.7 | -30% (absorbed) |
| Cloudy | 0.6 | -40% (absorbed) |
| Cloudy with/without precipitation | 0.4 | |
| Overcast | 0.3 | |
| Heavily overcast with/without rain/drizzle | 0.2 | -80% (absorbed) |
Note: The factor shown is determined by statistical analysis of weather effects.
Questions:
1. Complete the chart. What relationship do you see between cloud type and UV filtration?
2. From your knowledge of science, in what ways could water vapour or droplets affect the amount of UV radiation reaching the earth's surface?
Make a Rain Gauge
Environment and Climate Change Canada
Materials
- A plastic 2-litre pop bottle with straight sides
- Ruler at least 15 centimetres in length
- Scissors
- Stones or large gravel
- Clear tape
- Water
Method
- Cut the bottle about 10 centimetres from its top. Save the top part.
- Place stones or gravel in the bottom of the bottle until they fill the little bumps in the bottom and come up to the part of the bottle where the sides are straight. This will add weight to the gauge to make it more stable.
- Tape the ruler to the side of the bottle so that the zero mark on the ruler is a centimetre or two above the stones.
- Pour enough water into the bottle so that the water level is at the zero mark on the ruler.
- Take the top of the bottle (the part you cut off earlier), turn it upside down, and put it into the bottom portion so that it looks like a funnel.
- Set your gauge in an open area away from trees or buildings, which may affect the amount of rain that falls into the bottle.
- When it has rained, take a reading using the ruler taped to the side of the bottle. Then pour out the excess water until the water level is once again at zero. (If you pour out too much water, simply add more until the water level again reaches zero on the ruler.)
Points to discuss
If you leave your rain gauge out in the sun for a day, be sure to check the gauge as some of the water may evaporate. If that happens, just add water until the level is at zero again.
As a further exercise, you may want to tape a coffee filter into the funnel part of the gauge to collect any particles that fall into the gauge. The rainwater will drip through the filter and into the bottle eventually. You can then look at the filter through a microscope and see what it captured.
A Tasty Experiment!
Agriculture and Agri-Food Canada
This experiment has two parts... And even if you don't get the first one, the second one is delicious!
The experiment consists in growing sweet potatoes, Jerusalem artichokes or potatoes.
Materials
- A sweet potato bought at the grocery store (or Jerusalem artichoke or potato) in the spring and on which there is at least one small bud;
- A five-gallon bucket;
- A 35-L bag of earth (or a 40-L bag, if that's all there is);
- The spring and summer sun (hardly optional!).
Instructions
It's so easy! First, weigh all of the materials on a scale. With a pencil, record the weight on a sheet of paper you will leave close to the bucket, but out of the rain.
Pour one third to one half of the earth in the bucket, plant the sweet potato (or Jerusalem artichoke or potato), and water sufficiently.
As the plant grows, add more earth to the bucket. Remember to water the plant if, to the touch, the top two centimetres of earth is dry.
At the end of the summer, weigh all the materials on the scale again, and record the weight.
What do you observe?
To what is the difference in weight due? Is it perhaps simply the water you added? It can't be the earth you added, since you weighed everything before starting...
So, what caused the difference? Might there be something in the air that combined with the plant like Lego, to make it so heavy?
Now begins the second part. Make sure the earth isn't soaked. Pull the stalk with all of its leaves and put it on the compost pile. Bring the bucket indoors, preferably to the basement. You now have your own supply of sweet potatoes (or Jerusalem artichokes or potatoes) to last you till winter... maybe!
Tsunami Demonstration
Natural Resources Canada
Description
A short lab demonstration of tsunami waves.
Materials
- large basin of water
- wax crayon
- several corks
- rock to represent a meteorite
- bag of marbles
Teacher instructions and notes:
1. Fill a large basin with water to half its depth. Draw a line around the inside of the container at water level to represent 'sea level'. Float several corks in the water. Corks help to show the wave motion.
2. To simulate a tsunami caused by a meteorite landing in the ocean, drop a rock into the basin and watch the ripples (tsunami waves) move outward from the impact site.
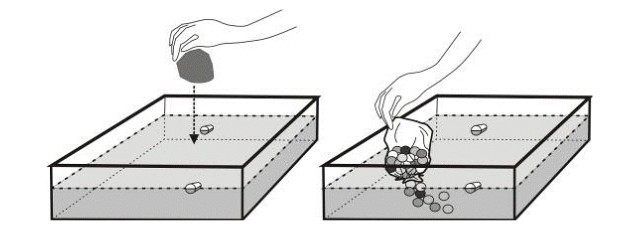
3. To simulate a tsunami caused by a landslide, hold the mouth of a bag full of marbles at water level. Quickly release the marbles into the water, simulating the submarine movement of a landslide.
4. It is harder to simulate an earthquake, but sharply hitting the basin can create a wave that will slosh up on one side of the basin.
5. Have the students observe the simulation or simulations.
6. Divide the students into small groups and allow them to produce their own tsunamis.
7. Have the students draw the waves that are generated in their experiment and summarize their observations in a brief written or oral report.
"Make Before Break"
Canadian Space Agency
Try this activity to discover some of the challenges astronauts face while working in space!
This activity illustrates the "make before break" strategy used in all Extravehicular Activity (space-walk)/Payload operations in space. "Make before break" means that whenever a tethered person or payload is moved from one location to another, one must always make a secure connection at the new location before one can break the connection at the original location. This insures that any item that has the potential to drift free is always tethered.
Concept
- Students' desks are arranged in groups or "clusters".
- The students will have various tasks to perform, requiring them to move from group to group.
- A student cannot move to another group unless the student is tethered at all times.
- A tether must only be long enough to reach an adjacent group, but not long enough to reach other groups.
Equipment needed
- Tethers made from lengths of light nylon cord (each about 2m long).
- 2 buckles for each tether, one at each end (with spring clips).
- 1 sturdy (immovable) anchor point for each student group. (TIP: Used 4L paint cans, filled with dry sand or gravel and with their lids hammered on make good objects to use as anchor points)
Procedure
Prepare the following materials.
- Make up sheets of paper (enough for each group) with the words "Solar Panels" written on them.
- Repeat step one with pages for
- Food Supply.
- Life Support Equipment.
- Scientific Equipment.
- Rocket Fuel.
- Habitation Modules.
- Communications Equipment.
- Emergency Equipment.
- Give one set of each of the pages to each group. In other words, one group gets all the "Solar Panel" pages, another group gets all the "Food Supply" pages and so on, so that each group has a monopoly on a specific resource.
- Give each group two tethers.
Challenge
To assemble a space station.
- Decide, as a class, the basic items required to build the space station.
- Each group must collect (from the other groups) the items needed to complete their space station.
- VERY IMPORTANT Review the strategy and tether protocol outlined below. It is essential that everyone understand the rules.
- Strategy:
- No more than three persons can be standing (call this "in EVA mode") at any one time.
- Resources must be collected directly from their source. i.e. They cannnot be passed from group to group.
- Tethers between groups can never cross.
- The "Make Before Break" rule must be adhered to at all times. No exceptions.
Conclusion
When all space stations have been completed discuss;
- any problems that may have arisen.
- possible solutions to such problems.
- how you might design a safety protocol that you could apply to make this construction simulation safer and more efficient.
TIP: The number of resources can be modified to suit the number of groups in the activity.
Also, this activity can be modified in many ways. For example, it might be combined with an art class whereby each group builds models of the resource package and they are "delivered" to a single group for assembly.